
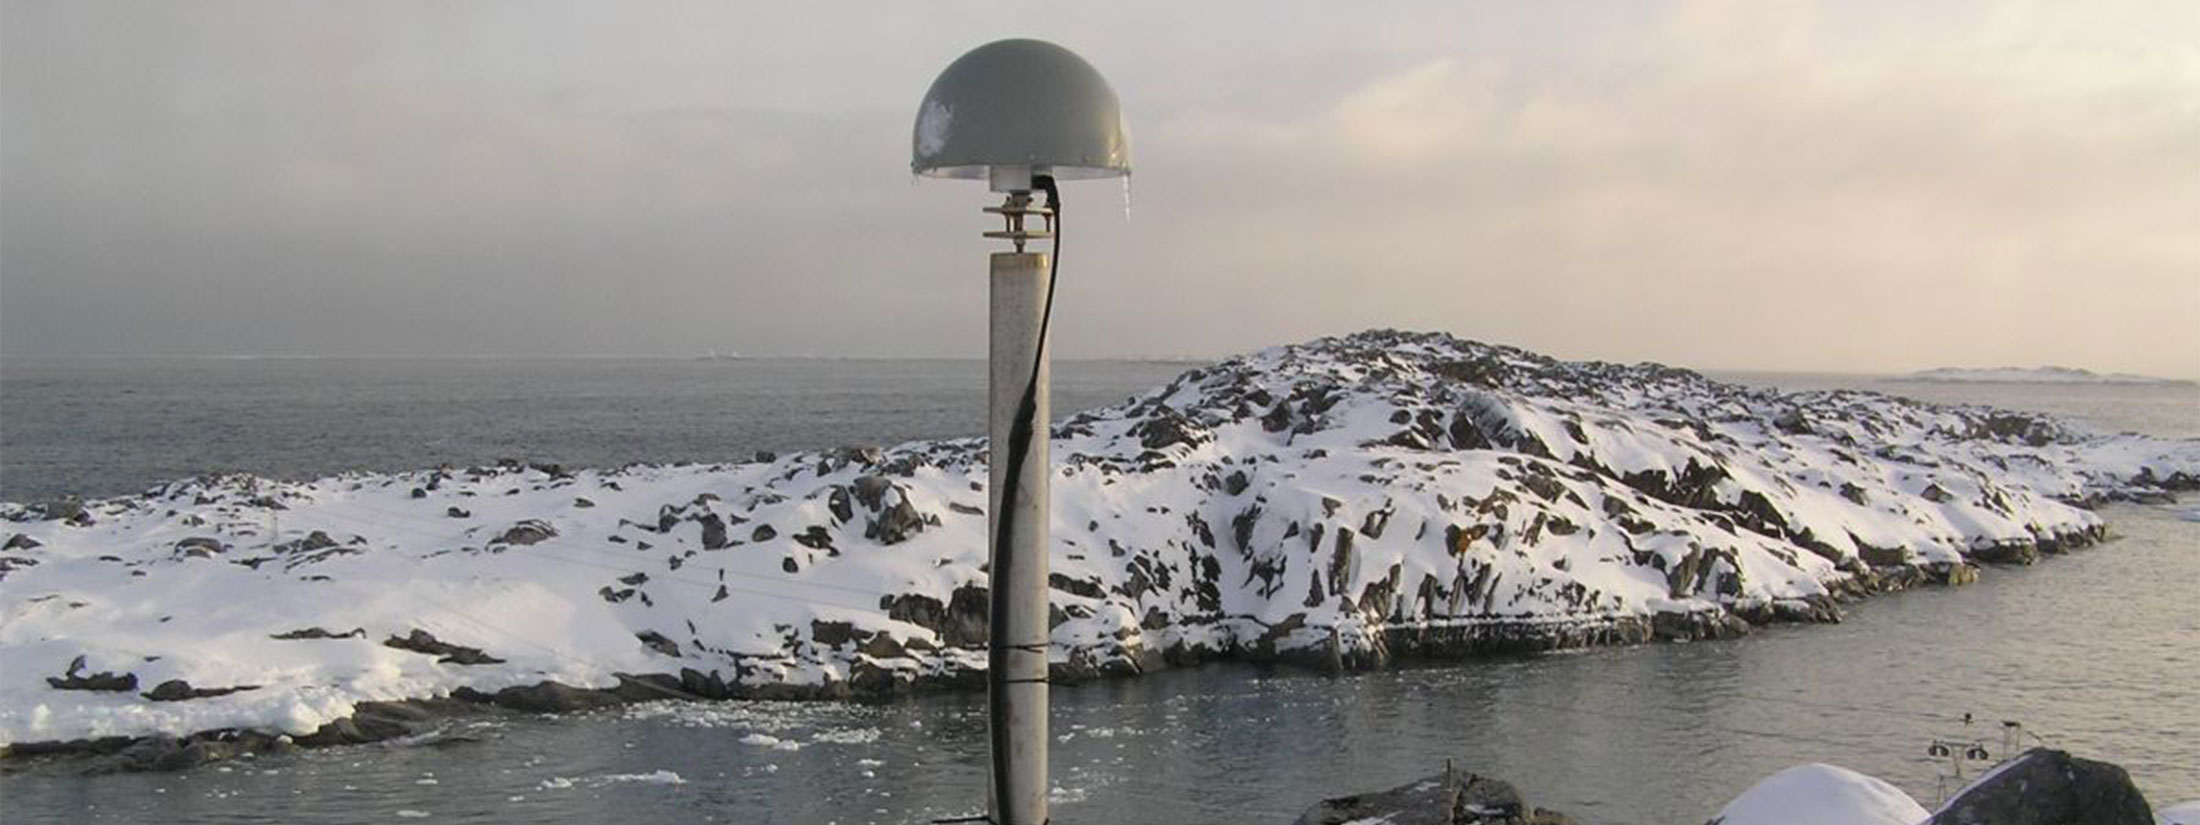
If the surface isn’t too rough, GNSS signals reflect off water surfaces. Unlike for soil moisture and snow depth, which varies most dynamically only on the day that it rains or snows, water levels vary throughout the day. This adds a bit of complexity for using the GPS/GNSS Interferometric Reflectometry (GPS-IR or GNSS-IR) technique to measure tidal variations for example. The advantage of using GNSS-IR with a standard geodetic receiver is that you can simultaneously measure the three-dimensional position of the GNSS antenna in the International Terrestrial Reference Frame.
In GNSS-IR, the GNSS signals reflecting from the water surface are measured using the Signal to Noise Ratio (SNR) data. The vertical distance between the GNSS antenna and the water is derived by the dominant frequency in the SNR data. Although it is not used to compute position, SNR is a standard observation recorded by a GNSS receiver. This little cartoon gives you an example of what the SNR observations might look like at high and low tide.
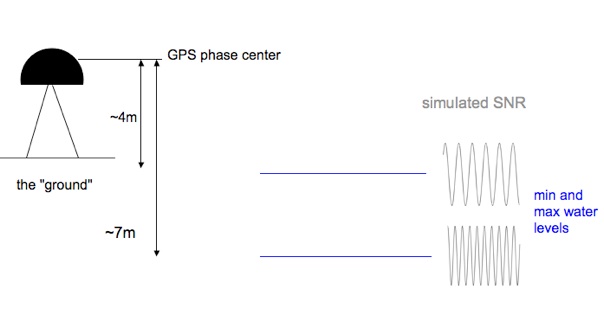
The effect of varying water levels (horizontal blue lines) is shown in this cartoon – reflections from 4 meters below the antenna are lower frequency than reflections from 7 meters.
GPS-IR was first demonstrated at sites at Onsala Radio Observatory(Sweden), Friday Harbor (Washington), and Peterson Bay (Alaska). Shown below are some results from the Peterson Bay effort. More details are available from the 2013 IEEE GRSL paper.
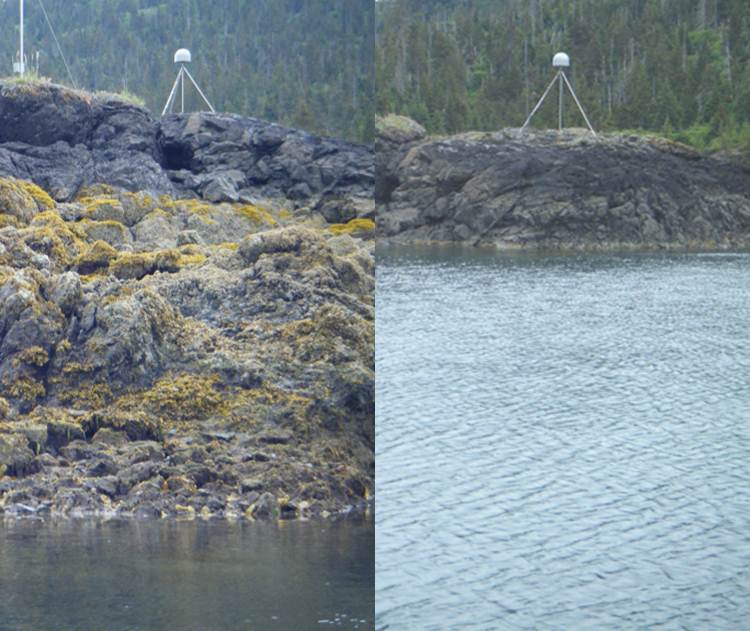
Photos of the Peterson Bay GPS site at low and high tide. Photo credit: Clara Chew.
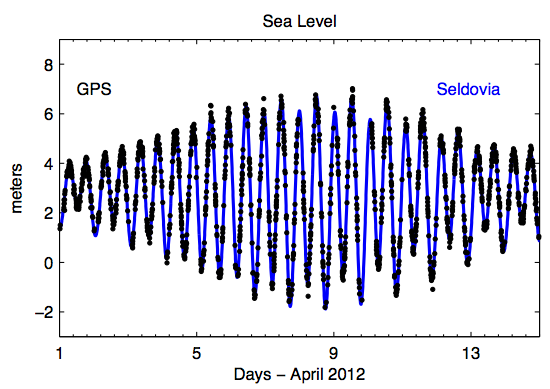
Water levels measured by NOAA (at Seldovia) and GPS (Peterson Bay).
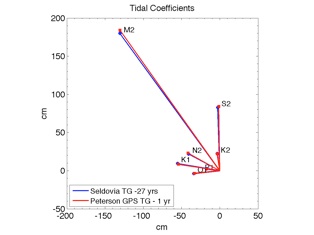
Tidal coefficients show good agreement between the “real” tide gauge and GPS.
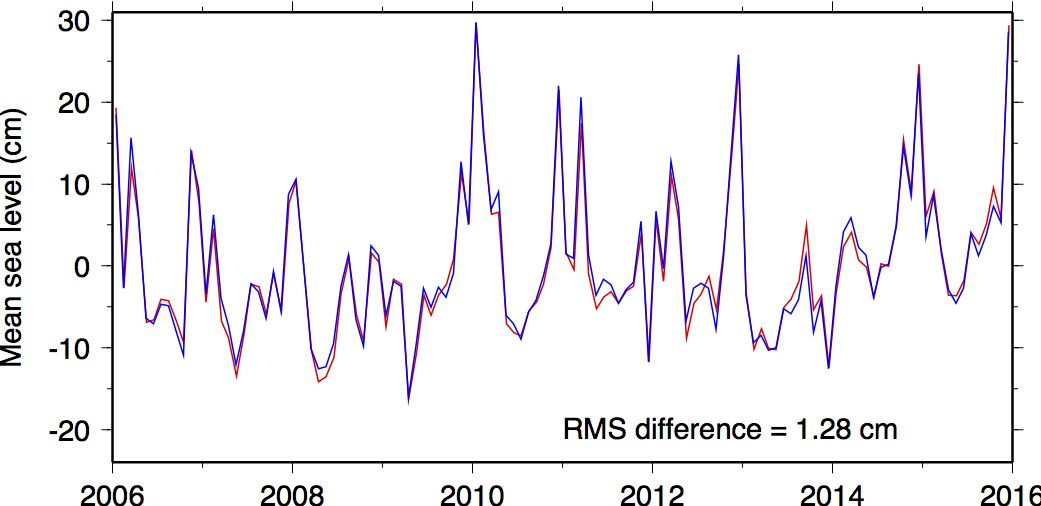
Comparison of monthly averages for GPS (blue) and NOAA (red).
A few years back Richard Ray (NASA Goddard Space Flight Center), Simon Williams (National Oceanography Centre) and I analyzed 10-year dataset from Friday Harbor, Washington. As shown to the right, long-term GPS-IR based water level estimates are very consistent with the tide gauge. For more information, see my website.
If you would like to try out GNSS-IR, I recommend you go to my gitHub account and download gnssrefl, the python package I developed with colleagues for GNSS-IR. I would also recommend doing some reading in the GNSS-IR literature to read about recent applications, including detecting storm surges, ice up, and significant wave height.